If you want to know what BMI charts are, how to read them, how to use them as a guide for tracking progress, and how they can help build muscle and lose body fat, you want to read this article.
BMI is one of the most frequently thrown around terms in the field of medicine.
If you’ve been to the doctor, or even a health screening at your place of work, you’ve probably been told you BMI as well as whether or not you needed to lose a few pounds.
But, what is BMI?
How do you calculate it, and more importantly, what can it tell you about your level of health and fitness?
In this article, we’ll discuss what BMI is, how to calculate it, the problems with BMI, and whether or not you should use it to track progress with your diet and training program.
Let’s start at the top.
What is BMI?
BMI stands for Body Mass Index.It is a numerical value calculated by dividing your weight in kilograms (kg) by your height in meters squared (m2). In other words, BMI is an expression of the relationship between your height and weight.
Researchers developed BMI as a means of determining whether an individual is of a healthy weight or not.
So, what’s a “healthy” weight according to BMI?
- Underweight = BMI of < 18.5
- Normal weight = BMI of 18.5 - 24.9
- Overweight = BMI of 25 - 29.9
- Obese = BMI of 30 or greater
Now, it’s worth mentioning that this is a general breakdown, as these numbers can be shifted up or down depending on the population to which they are being applied.
For instance, a few studies note that Asians have a greater risk of weight-associated diseases (type 2 diabetes and cardiovascular disease) despite having a “normal weight” according to the BMI calculation.[1,2] As a result, the limits of the different BMI categories (underweight, normal weight, etc.) are often altered slightly.
Another group of individuals for whom the BMI calculation is less than accurate are bodybuilders.
As you’re probably aware, bodybuilders typically carry around an incredible amount of muscle mass for their frame, much more than the average person who was the model that the BMI was developed for. Due to this, bodybuilders often have a BMI that classifies them as obese.
However, anyone that’s ever looked at a bodybuilder knows there is a big difference them and the 300-lb obese individual who is sedentary.
Who Created the BMI Calculation?
The equation for calculating BMI was developed by a Belgian named Adolphe Quetelet in 1832.[3] Quetelet was a mathematician, astronomer and statistician, who was entranced by the study of human physical characteristics and social aptitudes.During the course of his work, he spearheaded several cross-sectional studies centered around human growth and concluded that aside from growth spurts following birth and during puberty, a human’s weight increases as the square of his height.
He termed this relationship as the Quetelet Index and it remained as such for well over a hundred years.
It wasn’t until 1972 that a man by the name of Ancel Keys (yes, that Ancel Keys) coined the term Body Mass Index following the publication of some research noting an association between BMI and health problems.[4,6]
For those of you not familiar with the tale of Ancel Keys, he’s the researcher behind the Seven Countries Study[5] who played a pivotal role in establishing modern cardiovascular disease (CVD) epidemiology through the use misleading statistics which prompted the demonization of dietary fat and low-fat craze.
Thankfully, the narrative on dietary fat has been under revision in recent years, and it’s no longer viewed as the stuff that will clog our arteries and lead to an early grave.
But, let’s not get too carried away on a tangent about the follies and foibles of Keys.
Let’s get back to the BMI.
When Keys coined the term BMI, scientists needed a quick and easy method for estimating the body fat percentage of large groups of people.
Following the publication of Keys’ paper, they decided to use BMI as a figure for estimating the fatness of populations, which is essentially how it’s still used today.
Case in point, how many times have you had your BMI told to you by a doctor after he recorded your height and weight?
Chances are he was reading it off of a BMI Chart.
What is a BMI Chart?
A BMI Chart is just what it sounds like -- a chart (or table) that provides a quick way to figure out your BMI without having to do any metric to imperial units conversions or pull out a calculator.Depending on what your particular BMI is, you’ll also find out if you’re underweight, overweight, normal weight, or obese.
How Do I Use a BMI Chart?
Take a look at one of the BMI charts below.Find your weight along the top row and your height along the left column. Then, look across to find your BMI.
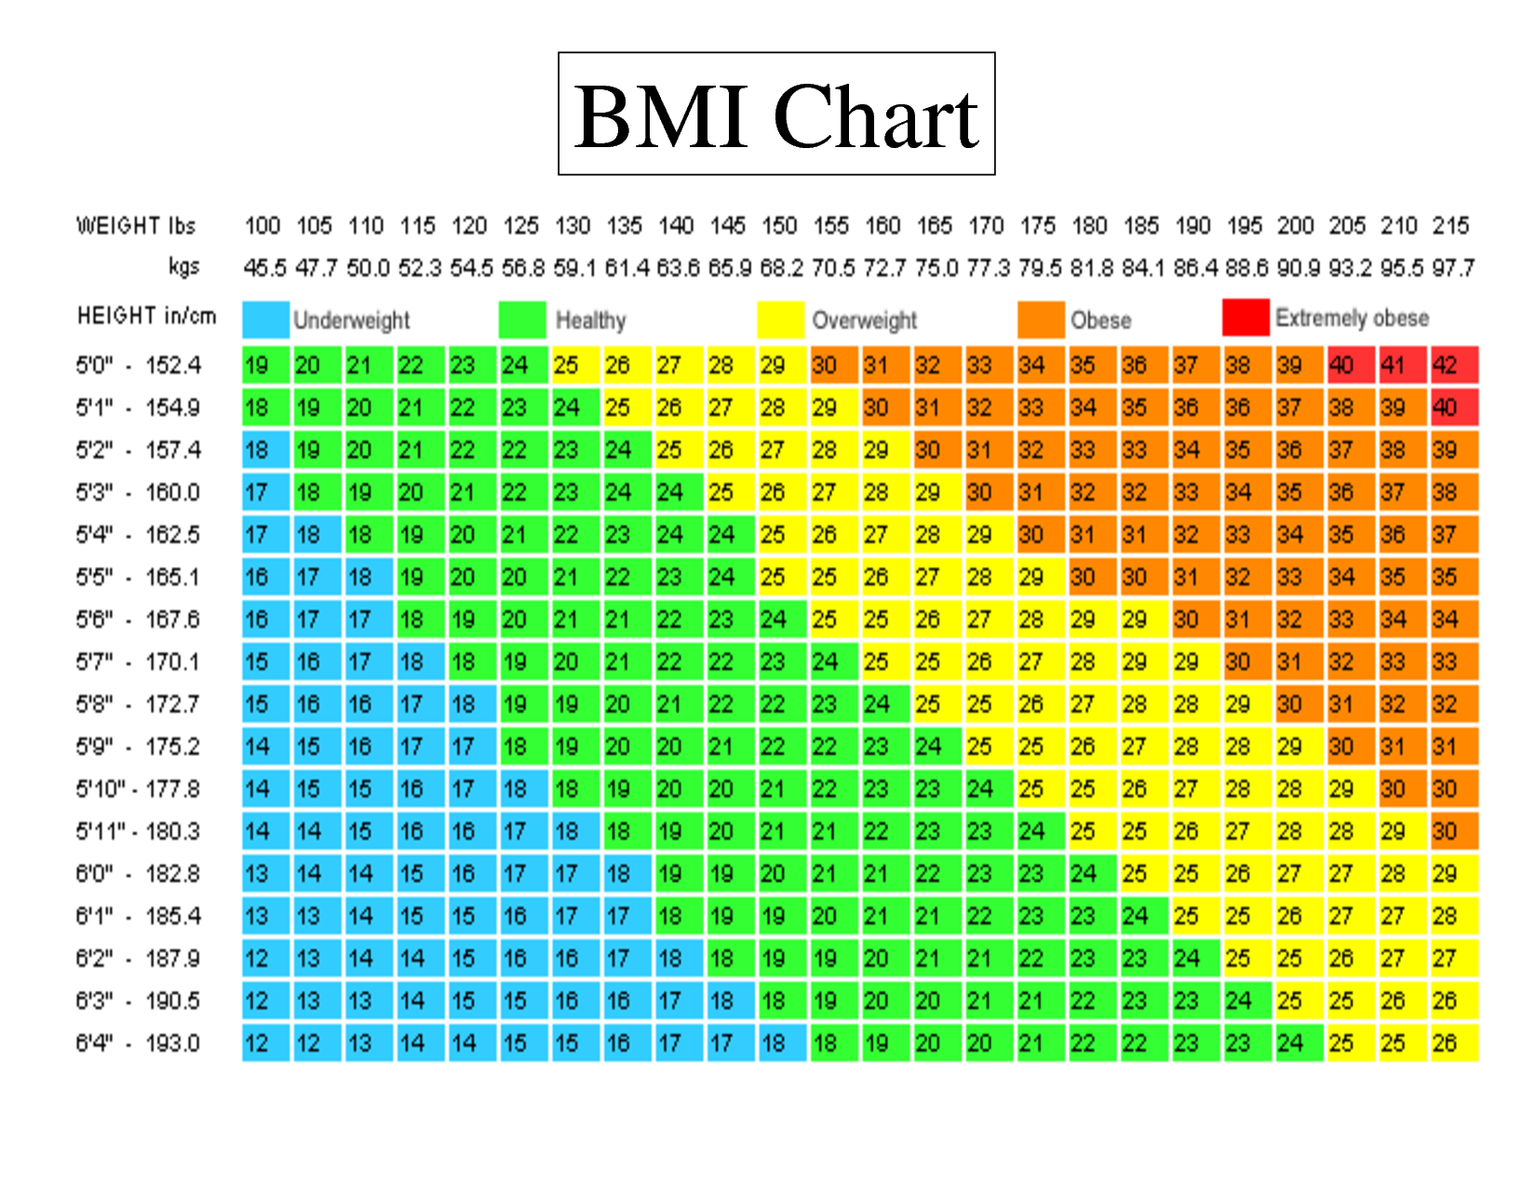
Image courtesy BusinessInsider.com
Here’s an example for determining BMI using the chart above just to make things crystal clear.
Let’s say we have a guy, who weighs 170 lbs and stands six feet tall.
Locating 180 pounds and six feet on the chart gives us a BMI of 23.
Our example guy is perfectly within the healthy or “normal weight” range of BMI.
Let’s use another example, this time we’ll use Primeval Labs athlete and IFBB pro Regan Grimes. If you’re not familiar with Regan, or his physique, here’s a recent picture from his instagram account:
Currently, Regan weighs 275 lbs and stands six feet tall.
As you quickly realized, if you tried to use the chart above, it doesn’t go all the way up to 275 lbs.
So let’s do it the old-fashioned way.
BMI = weight (kg) / [height (m)]2
To determine Regan Grimes’ weight in kilograms, divide 275 pounds by 2.2.
- Weight in kg = 275 / 2.2 = 125kg
To calculate his height in meters, we first need to convert 6 feet to inches. Since there are 12 inches in one foot, that means that Regan is 72 inches tall.
Now to convert inches to meters, we need to divide 72 by 39.37 gives us roughly 1.83 meters.
Next, we’ll plug these metric units into our BMI equation, which gives:
BMI = 125 / [(1.83)2] ~ 37.2
Now, according to the BMI calculator, Regan is technically obese.
However, most of you wouldn’t think that Regan is even overweight. In fact, he’s incredibly muscular and fit, but according to the BMI chart he’s overweight.
Is this a problem?
Well, research does show that individuals with a higher than normal body mass index have a greater risk of disease.
So, should you be worried if you have a higher than normal BMI?
Not really.
Allow us to explain why BMI isn’t the be-all, end-all for determining if you’re healthy or not.
Five Problems with Body Mass Index and BMI Charts
Despite the convenience BMI calculators and charts have for giving a 10,000 foot view of the relative fatness of a population, it’s not without fault.In fact, there are four major problems with BMI, according to experts:
- Just because you have a higher than normal BMI, does NOT mean that you’re necessarily overweight, or unhealthy for that matter. Case in point bodybuilders, they have low levels of fat and high amounts of muscle, yet they still have an above average BMI.
- Along those lines, BMI does not take into account how much muscle mass or lean body mass you actually have, and...
- It does not give a good estimate of how much body fat you're actually carrying around on your frame.[9]
- What gender you are can significantly impact your BMI. For example, a man and a woman with virtually identical body fat percentages could have vastly different body mass indices.
- The calculation for BMI does not account for your waist circumference. And yes, in this case size matters. In fact, obesity researchers have highlighted as a key indicator of health and risk for developing certain diseases, such as type 2 diabetes or cardiovascular disease.
Are BMI Charts Accurate or Helpful?
Honestly, it depends.Basically, if you’re obese by BMI charts standards, then chances are very high that you are actually obese.
But, what about the rest of the population?
Do BMI charts serve as a valid indicator of your health?
It might.
But, it depends on how many people you’re using it to assess.
For large groups, BMI charts tend to yield fairly decent estimates as to how fat or not a group of people is, generally speaking.
However, the readings of BMI charts become murkier when applying it to an individual.
For example, a meta-analysis carried out in 2010 reviewed the BMI results of 32,000 people and found that, based on BMI, half were either “normal weight” or “overweight.”
However, that same study also had the participants body fat percentage measured directly using other methods (bioelectrical impedance analyzers),[11] which have their own drawbacks, as we’ve discussed before, here.
Based on direct body fat percentage measurements, it turns out a lot of the “normal” and “overweight” individuals were actually obese.[11]
So, in other words, BMI underestimates how fat a person may be.
Various other research trials have found much of the same thing -- BMI underestimates how many people are overweight and obese.[12,13,14]
Are BMI Charts Accurate for Muscular People (i.e. Bodybuilders)?
As we displayed up top, when discussing Regan Grimes, BMI charts are not really reliable for accurately assessing whether or not people who lift are overweight or not.Then again, you might say Regan is a bit of an “outlier” given that he’s competing at the top levels of his sport.
What about the average gym rat who likes to lift weights, build muscle, and look aesthetic.
Is the BMI chart useful or accurate for them?
Well, let’s first understand who the standard BMI charts were developed for.
BMI Charts were developed under the assumption that the people being measured carried a relatively normal amount of lean body mass (meaning those who don’t aspire to build lots of muscle).
For most people, the amount of lean body mass they have remains relatively stable, with the majority of their body composition changes coming from differences in their body fat levels.
Based on this, if someone is “overweight” according to the BMI chart, it’s fairly certain that they are actually carrying around an excess of body fat.
Additionally, most average people have an average amount of muscle mass, which means BMI charts will likely be on point.
So, back to the gym crowd, the ones who actually train to build muscle and not the ones who go to the gym just to “workout.”
Is the BMI chart valid?
Well, even the most genetically blessed natural bodybuilders out there, approaching their genetic peak, would barely fall into the overweight category. Again this isn’t an issue[15], as long as you have a relatively low amount of body fat.
So, provided you’re not hopped up on a bunch of “special” sports supplements, chances are pretty good that the BMI chart is a good indicator for you, even if you’re close to your genetic potential.
Does Bone Density Affect BMI?
Another common complaint against BMI is that it doesn’t account for the weight or mass of your skeleton. Therefore, if you have dense bones (big-boned) you could erroneously be categorized as overweight or obese.But, does this theory hold water?
Well...let’s discuss.
Bone density is determined (and affected) by resistance-training, activity levels, and genetics.[16,17,18]
Your skeleton accounts for roughly 15% of your total body weight, and roughly 25% of that amount is comprised of water and fat.[19]
The other 75% of your bone mass is comprised of minerals, such as calcium.
Technically speaking, a “big boned” person could have a higher mineral content than a smaller boned person, but does this have any meaningful difference in terms of body weight, and therefore BMI?
Not really.
Here’s an example to help us drive the point home.
Let’s say we have our example 170 pound guy from earlier.
We’ll assume that 15% of that 170 lbs (25.5 pounds) is his skeleton.
75% of those 25.5 pounds is the estimated mineral weight of his bones, which would be:
25.5 * .75 = 19.125 pounds
Now, let’s say you follow a rigorous training program and increase your bone density by 5%, which by all accounts is what you would expect from consistent training.
The 5% increase would mean that your skeleton now weighs roughly 20.08 pounds (19.125 * 1.05 to account for the 5% increase). That’s not even a pound of difference, which means you’re total body weight barely shifts, and subsequently, doesn’t do much to change your BMI one way or the other.
So, the concept of saying BMI is inaccurate due to being “big boned” is itself, inaccurate.
But, that still doesn’t mean that BMI is a stellar indicator for overall health or even for tracking body composition.
This begets the question...
What is Better than BMI for Assessing Health & Tracking Progress?
Tracking body composition.Body composition is a breakdown of the amounts of muscle, fat, bone, and water your body contains, and it provides a far more accurate means for tracking health.
There are several different methods for calculating body composition, but most suffer a fatal flaw of some form or another. The easiest and simplest way to track body composition for the majority of people is to track their fat mass and fat-free mass.
Fat mass is pretty self-explanatory. It’s the amount of fat covering your body.
Fat-free mass is everything that isn’t fat -- muscles, bones, organs, water, blood, etc.
By tracking just these two metrics, rather than BMI or body weight, provides a better understanding of your fitness as well as give a reading on how your progressing with your training.
The easiest way to do that is with four simple tools:
- Body fat calipers.
- Tape measure to track waist circumference.
- A camera to take progress pictures as well as the mirror.
- A bathroom scale
If you’d like to learn more about how to measure your body fat percentage and track changes in body composition the easy way, click here.
What makes this a superior method to using BMI charts and calculators?
Well, using calipers provides a rough idea of whether you're gaining fat or losing fat based on the caliper reading. The bigger the number, the fatter you are. The smaller the number, the leaner you are.
Progress pictures and the mirror give a visual representation for what you actually look like, giving a more subjective marker for how you’re progressing with your physique.
The bathroom scale gives a general idea as to whether you’re gaining or losing weight. It’s too raw of a marker to be the only metric used for assessing progress, but it can still let you know if your mass gaining or fat loss diet has you headed in the right direction.
And that brings us to waist circumference.
Waist Circumference and Health
Again, this gives an indication if you are gaining or losing body fat.But that’s not all, studies note a strong association between excess body fat around the midsection and type 2 diabetes as well as the risk of heart attack.[20,21]
A separate study involving over 340,000 Europeans documented that men and women who were overweight with “large waists” (men >40 inches and women > 34.5 inches) had a lower risk of developing diabetes than people who were clinically obese.[22]
In other words, having a smaller waist is generally associated with better health and body composition.
However, waist circumference isn’t the only thing worth tracking as a number of studies have found no correlation between it and increased risk of cardiovascular disease.[23]
That’s why we include it as one of the four tools you should use to track body composition.
The Bottom Line on BMI Charts
BMI calculators and charts provide a quick, easy way to get an estimate regarding whether a person’s weight is healthy or not. However, it neglects far too many attributes (sex, amount of lean muscle mass, body fat percentage, etc.) to be the only barometer used to assess health and wellness.Just as a bathroom scale should not be the only indicator you use to assess the success or failure of a diet and training program, neither should you rely on BMI charts and calculators as the sole barometer of success.
If you’re “obese” according to a BMI chart, then chances are pretty good that you actually are obese and should try to lose weight.
If you are “overweight” according to a BMI chart, then you most likely have a bit too much body fat, or have a decent amount of muscle and close to your natural, genetic limit for muscle building.
In the end, rather than focus on your BMI, you’d be better served to track your body fat percentage using a set of calipers, bathroom scale, tape measure, and pictures.
References
- Misra A and Bhardwaj S. "Obesity and the Metabolic Syndrome in Developing Countries: Focus on South Asians. - PubMed - NCBI." National Center for Biotechnology Information, www.ncbi.nlm.nih.gov/pubmed/24504214.
- Misra A and Khurana L. "The Metabolic Syndrome in South Asians: Epidemiology, Determinants, and Prevention. - PubMed - NCBI." National Center for Biotechnology Information, www.ncbi.nlm.nih.gov/pubmed/19900153.
- Garabed Eknoyan; Adolphe Quetelet (1796–1874)—the average man and indices of obesity, Nephrology Dialysis Transplantation, Volume 23, Issue 1, 1 January 2008, Pages 47–51, https://doi.org/10.1093/ndt/gfm517
- Keys A , et al. "Indices of Relative Weight and Obesity. - PubMed - NCBI." National Center for Biotechnology Information, www.ncbi.nlm.nih.gov/pubmed/4650929.
- Kromhout D: Serum cholesterol in cross-cultural perspective. The Seven-Countries Study. Acta Cardiol 1999;54:155–158
- "Body Mass Index: Obesity, BMI, and Health A Critical Review : Nutrition Today." LWW, journals.lww.com/nutritiontodayonline/Fulltext/2015/05000/Body_Mass_Index__Obesity,_BMI,_and_Health_A.5.aspx.
- "Body Mass Index Table 1." Home | National Heart, Lung, and Blood Institute (NHLBI), www.nhlbi.nih.gov/health/educational/lose_wt/BMI/bmi_tbl.htm.
- "Body Mass Index, Waist Circumference, and Risk of Coronary Heart Disease: a Prospective Study Among Men and Women." PubMed Central (PMC), www.ncbi.nlm.nih.gov/pmc/articles/PMC2992336/.
- "Healthy Percentage Body Fat Ranges: an Approach for Developing Guidelines Based on Body Mass Index." OUP Academic, 1 Sept. 2000, ajcn.nutrition.org/content/72/3/694.full
- "Waist Circumference and Cardiometabolic Risk." Diabetes Care, 1 June 2007, care.diabetesjournals.org/content/30/6/1647.
- Romero-Corral A, Somers VK, Sierra-Johnson J, et al. Accuracy of body mass index in diagnosing obesity in the adult general population. Int J Obes (Lond). 2008;32(6):959-66. https://www.ncbi.nlm.nih.gov/pmc/articles/PMC2877506/
- Kennedy AP , et al. "Comparison of the Classification of Obesity by BMI Vs. Dual-energy X-ray Absorptiometry in the Newfoundland Population. - PubMed - NCBI." National Center for Biotechnology Information, www.ncbi.nlm.nih.gov/pubmed/19360011.
- Shah NR, Braverman ER. Measuring adiposity in patients: the utility of body mass index (BMI), percent body fat, and leptin. PLoS One. 2012;7(4):e33308. https://www.ncbi.nlm.nih.gov/pmc/articles/PMC3317663/
- "Accuracy of Body Mass Index to Diagnose Obesity In the US Adult Population." PubMed Central (PMC), www.ncbi.nlm.nih.gov/pmc/articles/PMC2877506/.
- Goonasegaran AR , et al. "Comparison of the Effectiveness of Body Mass Index and Body Fat Percentage in Defining Body Composition. - PubMed - NCBI." National Center for Biotechnology Information, www.ncbi.nlm.nih.gov/pubmed/22711041.
- Arden NK and Spector TD. "Genetic Influences on Muscle Strength, Lean Body Mass, and Bone Mineral Density: a Twin Study. - PubMed - NCBI." National Center for Biotechnology Information, www.ncbi.nlm.nih.gov/pubmed/9421240.
- Kelley GA , et al. "Exercise and Bone Mineral Density in Premenopausal Women: a Meta-analysis of Randomized Controlled Trials. - PubMed - NCBI." National Center for Biotechnology Information, www.ncbi.nlm.nih.gov/pubmed/23401684.
- Braun SI, Kim Y, Jetton AE, Kang M, Morgan DW. Prediction of bone mineral density and content from measures of physical activity and sedentary behavior in younger and older females. Prev Med Rep. 2015;2:300-5. Published 2015 Apr 25. doi:10.1016/j.pmedr.2015.04.012 https://www.ncbi.nlm.nih.gov/pmc/articles/PMC4721477/
- AGNA JW, KNOWLES HC, ALVERSON G. The mineral content of normal human bone. J Clin Invest. 1958;37(10):1357-61. https://www.ncbi.nlm.nih.gov/pmc/articles/PMC1062811/?page=1
- "Waist Size Linked to Type 2 Diabetes Risk ? Regardless of BMI." Diabetes UK, 8 June 2012, www.diabetes.org.uk/About_us/News_Landing_Page/Waist-size-linked-to-Type-2-diabetes-risk--regardless-of-BMI/.
- E., P. S. A., H., B. S., & Mark, W. (2018). Sex Differences in the Association Between Measures of General and Central Adiposity and the Risk of Myocardial Infarction: Results From the UK Biobank. Journal of the American Heart Association, 7(5), e008507. https://doi.org/10.1161/JAHA.117.008507
- "Long-Term Risk of Incident Type 2 Diabetes and Measures of Overall and Regional Obesity: The EPIC-InterAct Case-Cohort Study." PLOS | Public Library Of Science, 5 June 2012, journals.plos.org/plosmedicine/article?id=10.1371/journal.pmed.1001230.
- Freiberg MS , et al. "BMI Vs. Waist Circumference for Identifying Vascular Risk. - PubMed - NCBI." National Center for Biotechnology Information, www.ncbi.nlm.nih.gov/pubmed/18239660.


Leave a comment
This site is protected by hCaptcha and the hCaptcha Privacy Policy and Terms of Service apply.